

Track all your AI coding usage and limits.One picture.

Know what your AI coding actually costs, how close you are to each limit, and where your usage is heading. Tokens, requests, models, and cost across your tools, in one running total.

Works withCodexClaudeCursorOpenCodeand more coming soon

No account required. Create a free account if you want to save and restore your usage history.

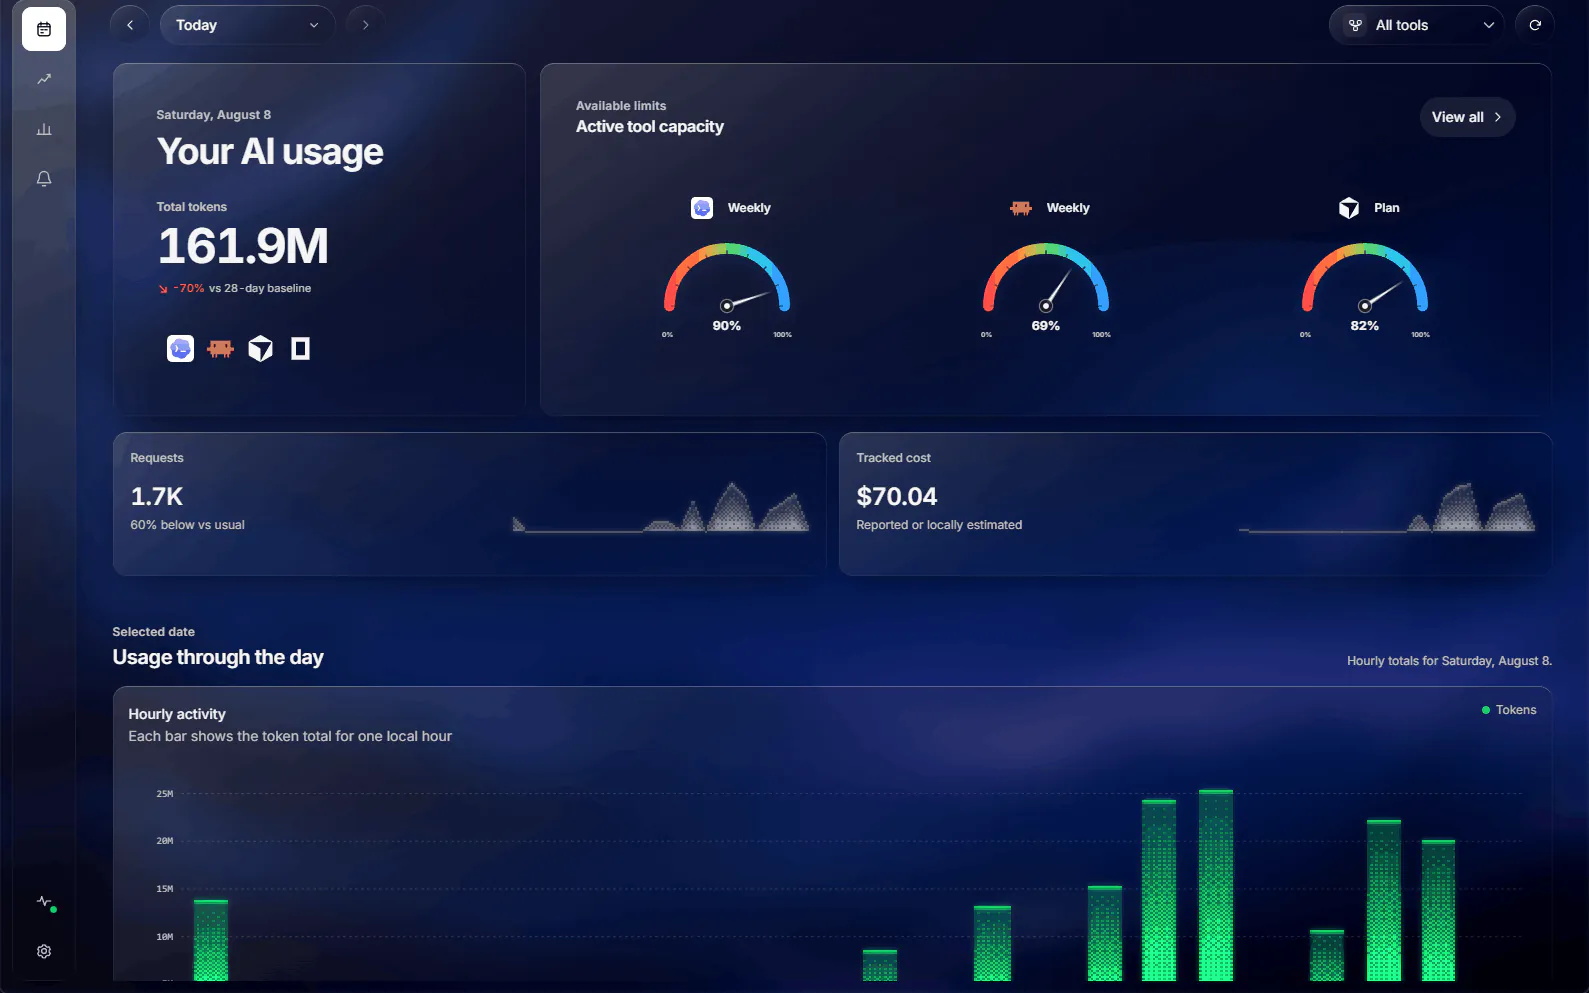
The UsageAtlas Today view: 161.9 million tokens for the day, three capacity gauges for the connected tools, requests and tracked cost, and an hourly token chart.
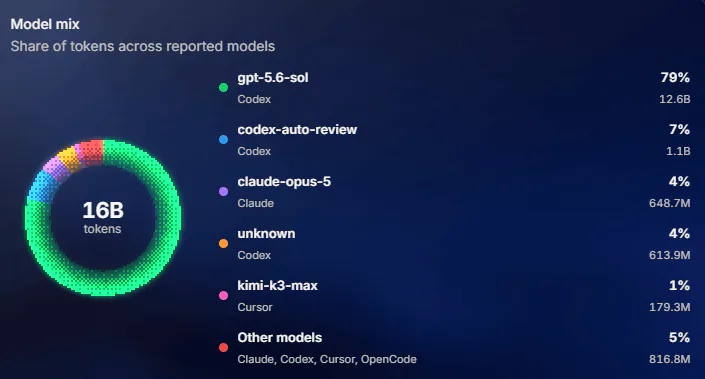
A model mix donut totalling 16 billion tokens, led by gpt-5.6-sol at 79 percent, then codex-auto-review, claude-opus-5, and other models.

Sources

Four tools today. More on the way.

A source ships only once its sign-in path, its error handling, and its adapter tests are finished, so everything below is pulling real numbers right now. New coding tools join the same running total as they settle.

  • Codex

    Goes through the signed-in Codex CLI’s own local app-server API.

    • Session window
    • Weekly window
    • Plan
    • Credits
  • Claude

    Uses the Claude OAuth credentials already stored on this computer.

    • 5-hour window
    • Weekly window
    • Plan
    • Extra-usage credits
  • Cursor

    Reuses your signed-in Cursor desktop session from read-only local state.

    • Plan
    • Auto + Composer
    • API
    • 90-day history
  • OpenCode

    Reads the local OpenCode database for per-step activity.

    • Tokens
    • Requests
    • Models
    • Sessions

Today

The day you are actually having.

Your token count sits against your own 28-day baseline rather than some average user’s. Below it you get the hours that produced those tokens, the tools that spent them, and the cost attached to both.

  • Hourly token totals for any date you pick
  • Provider mix, so you can see which tool carried the day
  • Token mix across fresh input, cache reads, cache creation, and output
  • Cost taken from the tool when it reports one, estimated locally when it does not
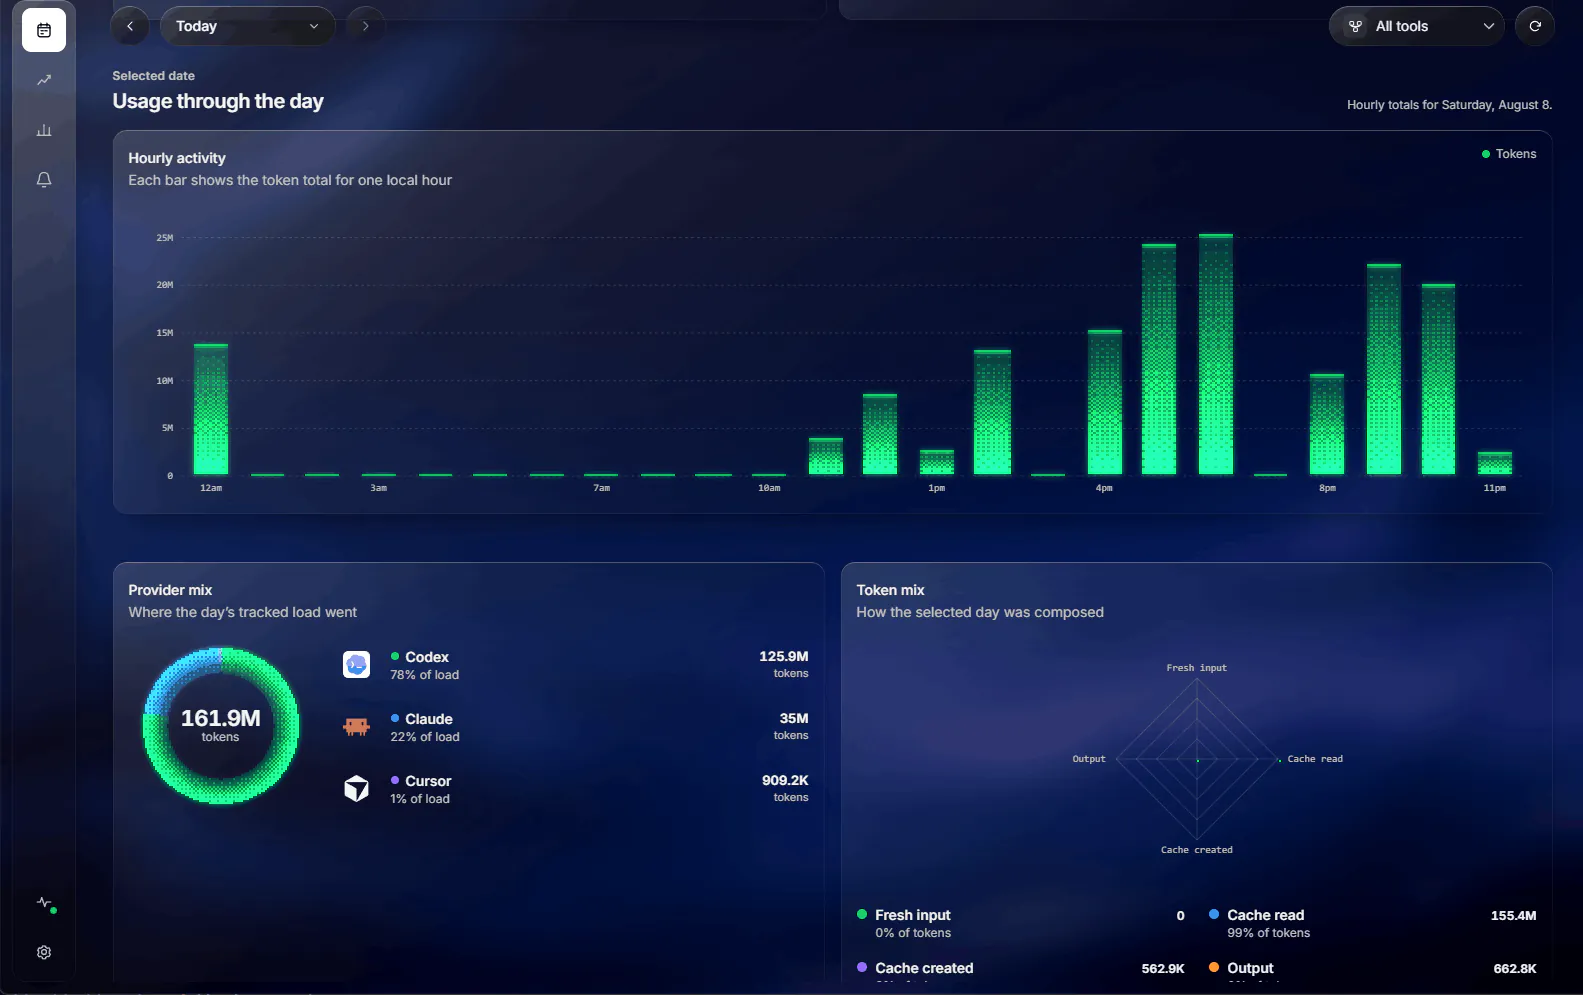
Hourly activity for a single day beside a provider mix donut showing Codex at 78 percent, Claude at 22 percent, and Cursor at 1 percent, plus a token mix breakdown.
Live capacity
Every metered window your tools report, with the clock time it resets.
Local analytics
Tokens, requests, and cost, read from sessions stored on this machine.
Your own baseline
Today measured against how you normally work over the last 28 days.

History

Seven days, ninety, or everything you have collected.

Every headline number carries its change against the period before it, so a heavy week reads as a heavy week instead of a figure with no past behind it.

  • Token load and cost plotted day by day across the range
  • Peak day, active days, and averages per day actually covered
  • Compare mode for the previous period, on or off
  • Days with no data stay empty on the chart instead of being drawn as zero
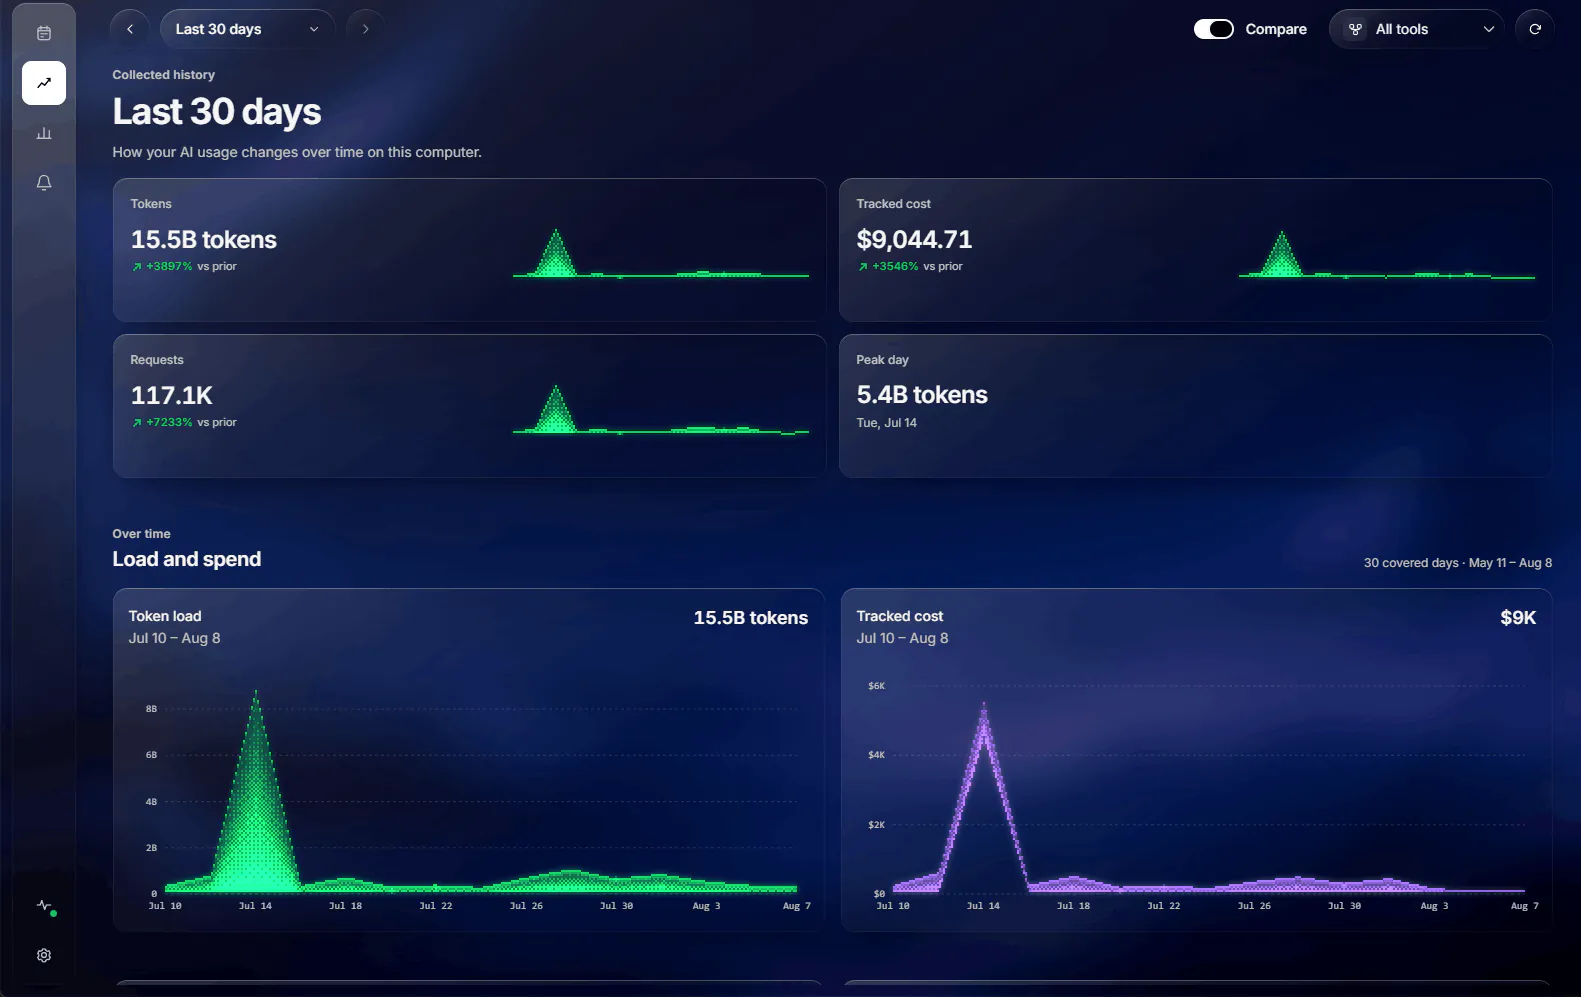
The History view over the last 30 days: 15.5 billion tokens, 9,044 dollars of tracked cost, 117.1 thousand requests, and load and spend plotted day by day.

Insights

The shape of your week, drawn from your own history.

All of it is built from session files already on your disk: the hours you reach for a model, the models you actually use, and how the load spreads across the week.

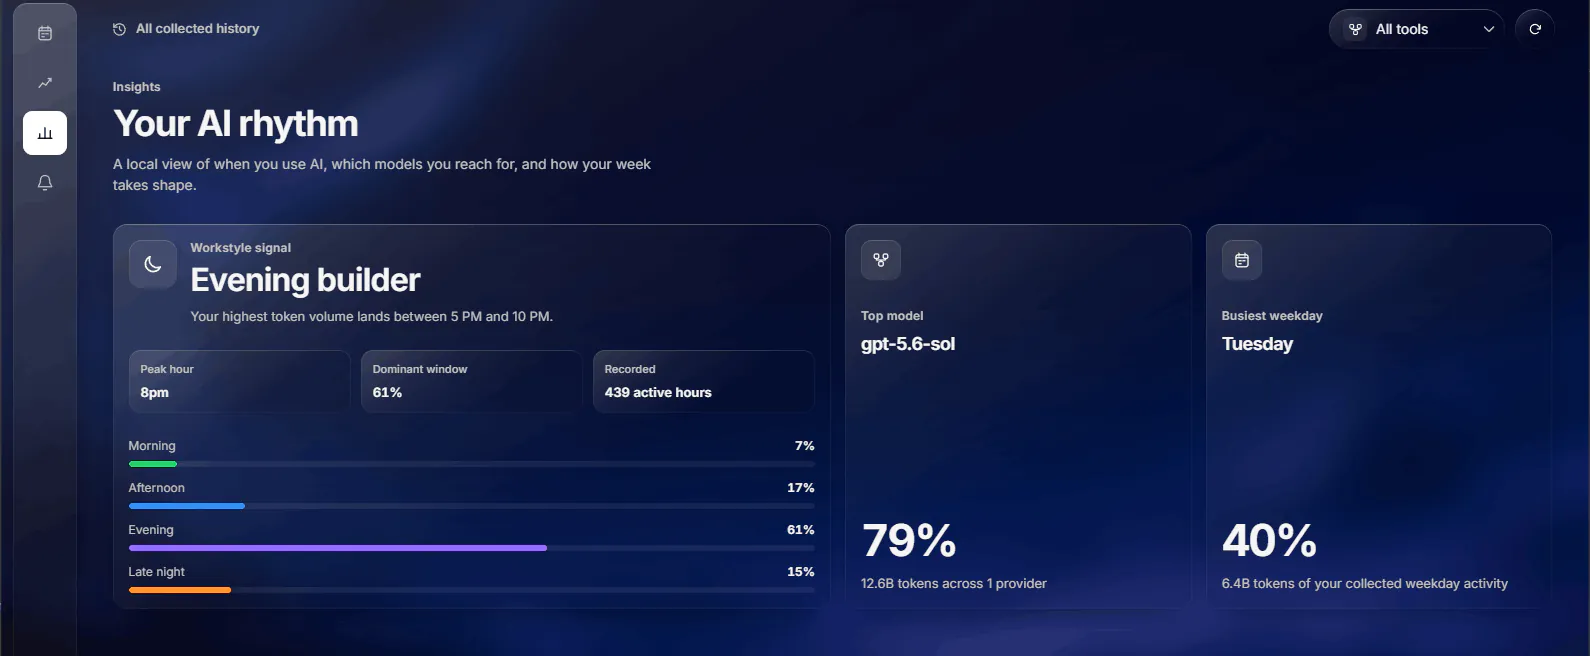
The Insights view labelling the workstyle signal as Evening builder, with peak hour 8pm, a morning to late-night split, top model, and busiest weekday.

Your typical week

Two-hour blocks in local time, normalised to your busiest block, across every day the app has collected.
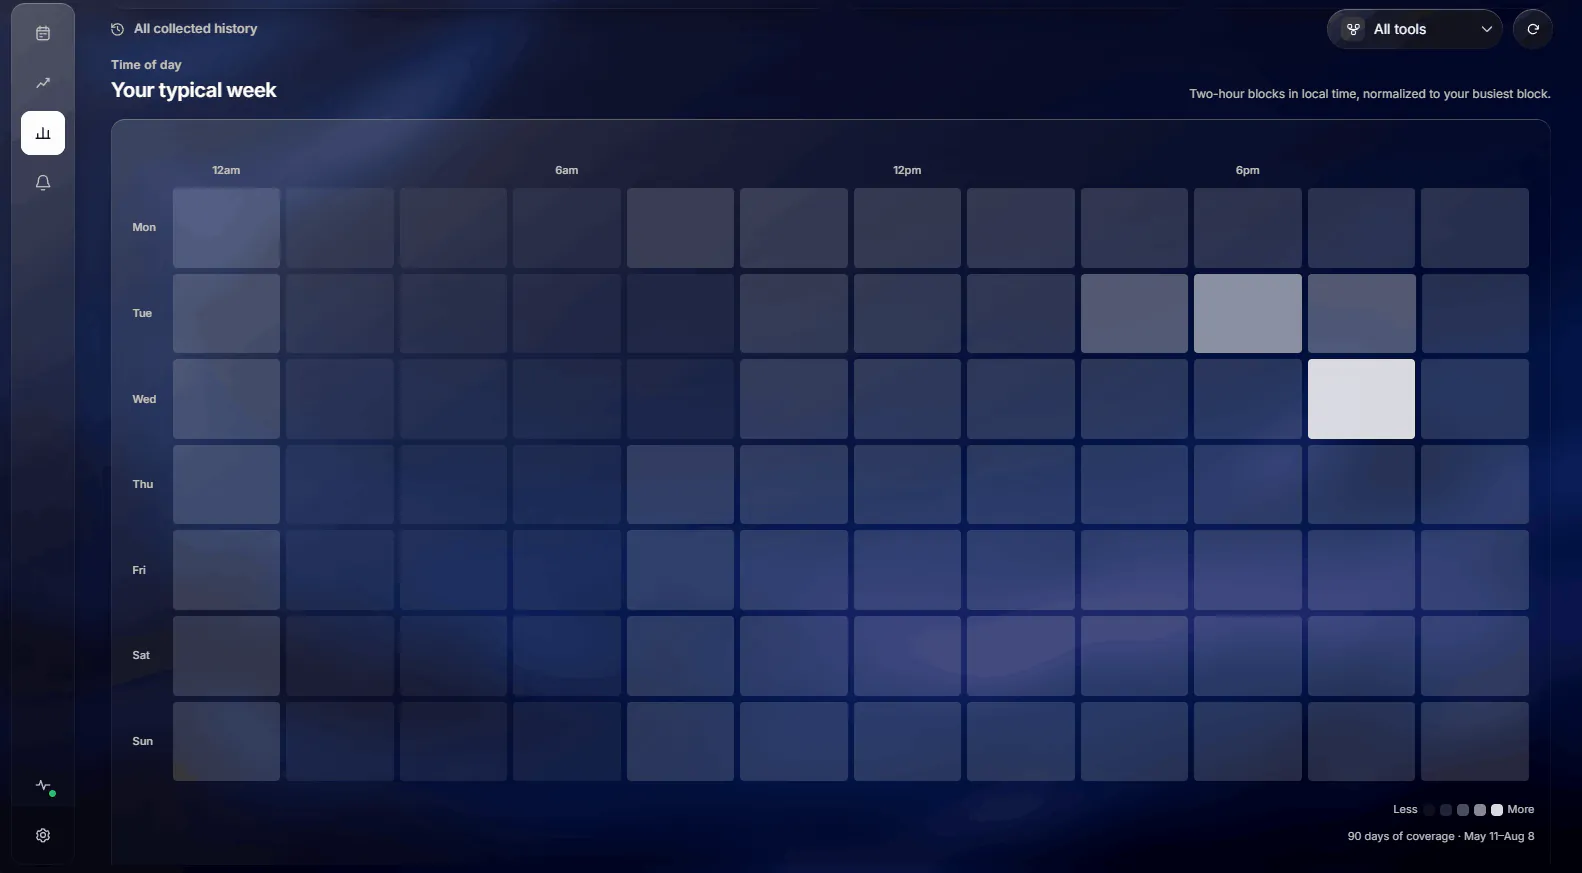
A weekly heatmap of AI activity in two-hour blocks, Monday through Sunday, with the brightest block on Wednesday evening.

Model mix

Share of tokens across every model your tools report, down to the ones you forgot you were still calling.

A model mix donut totalling 16 billion tokens, led by gpt-5.6-sol at 79 percent, then codex-auto-review, claude-opus-5, and other models.

Weekday balance

Which days carry the load, measured against your busiest weekday.
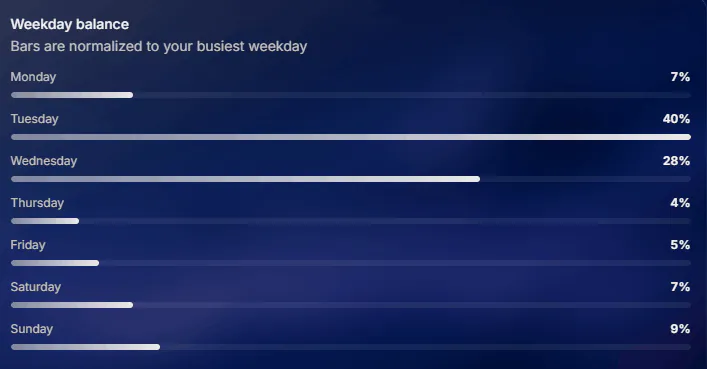
Weekday balance bars normalised to the busiest weekday, with Tuesday at 40 percent and Wednesday at 28 percent.

Limits and alerts

A warning while you can still do something about it.

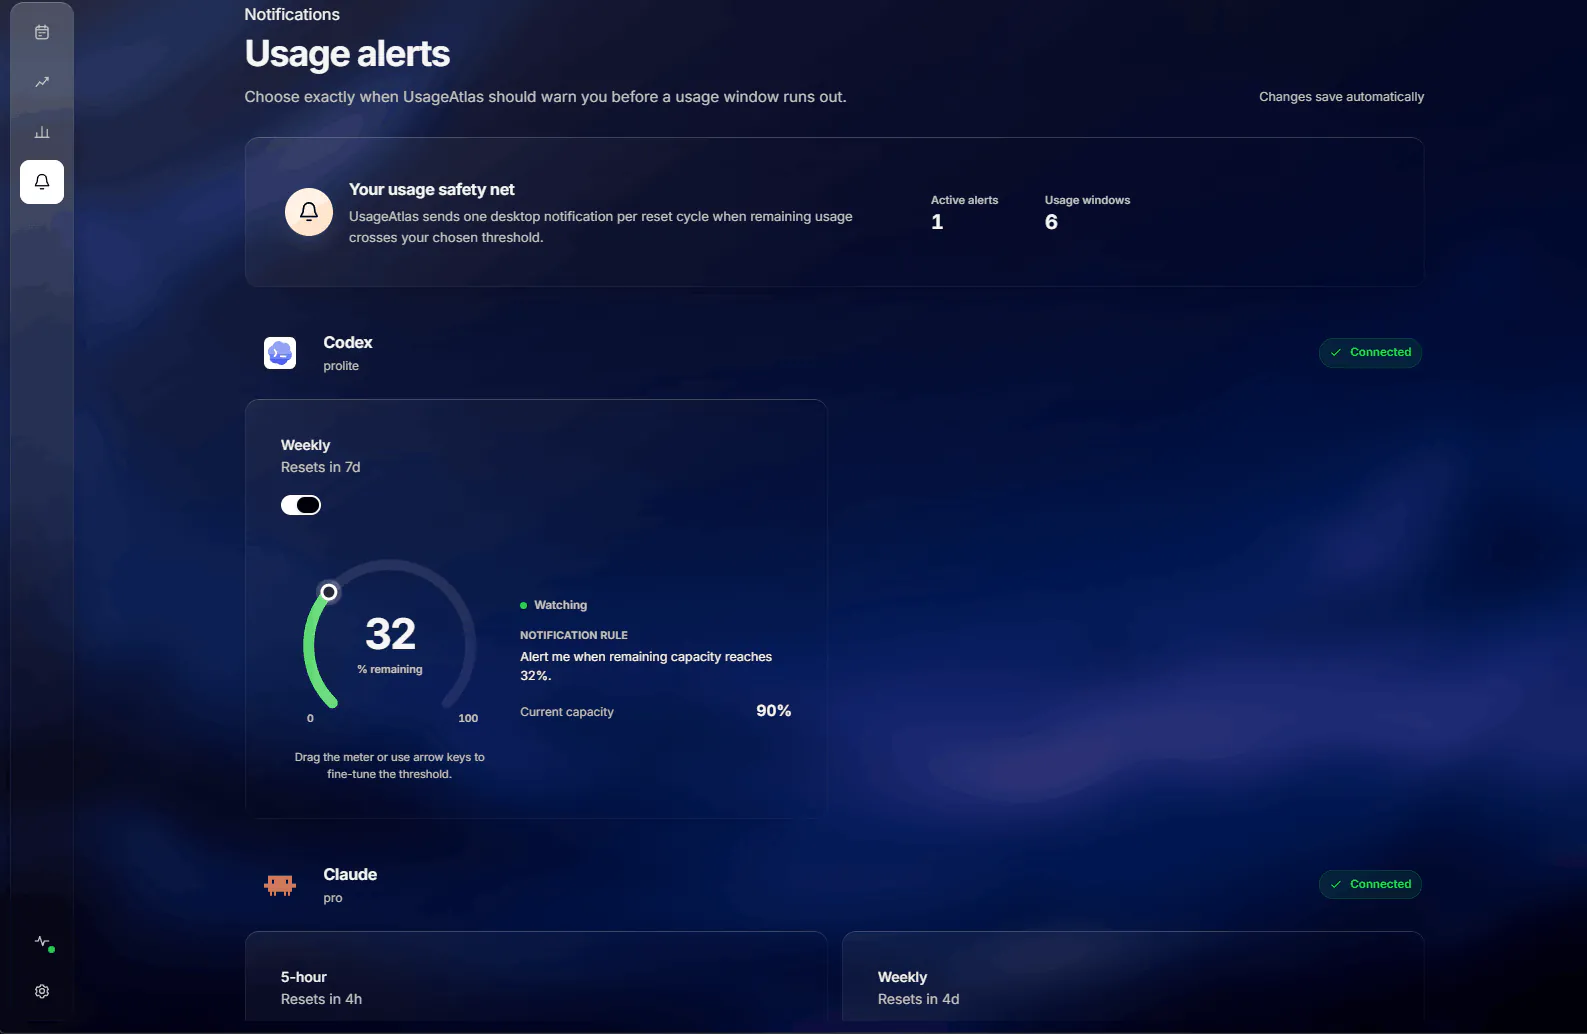
Set a remaining-capacity threshold per window, per tool. You get one desktop notification each reset cycle, and opening it drops you on the window that fired.
  • Every window starts switched off, and you turn on only the ones you care about
  • A dial for each window that you can drag or nudge with the arrow keys
  • One notification per reset cycle, rather than a stream of them
  • Windows keep refreshing while the app sits in the tray, so the numbers are current when you look
The Usage alerts view with one active alert across six usage windows, showing a Codex weekly window set to warn at 32 percent remaining capacity.

Every metered window, grouped by tool
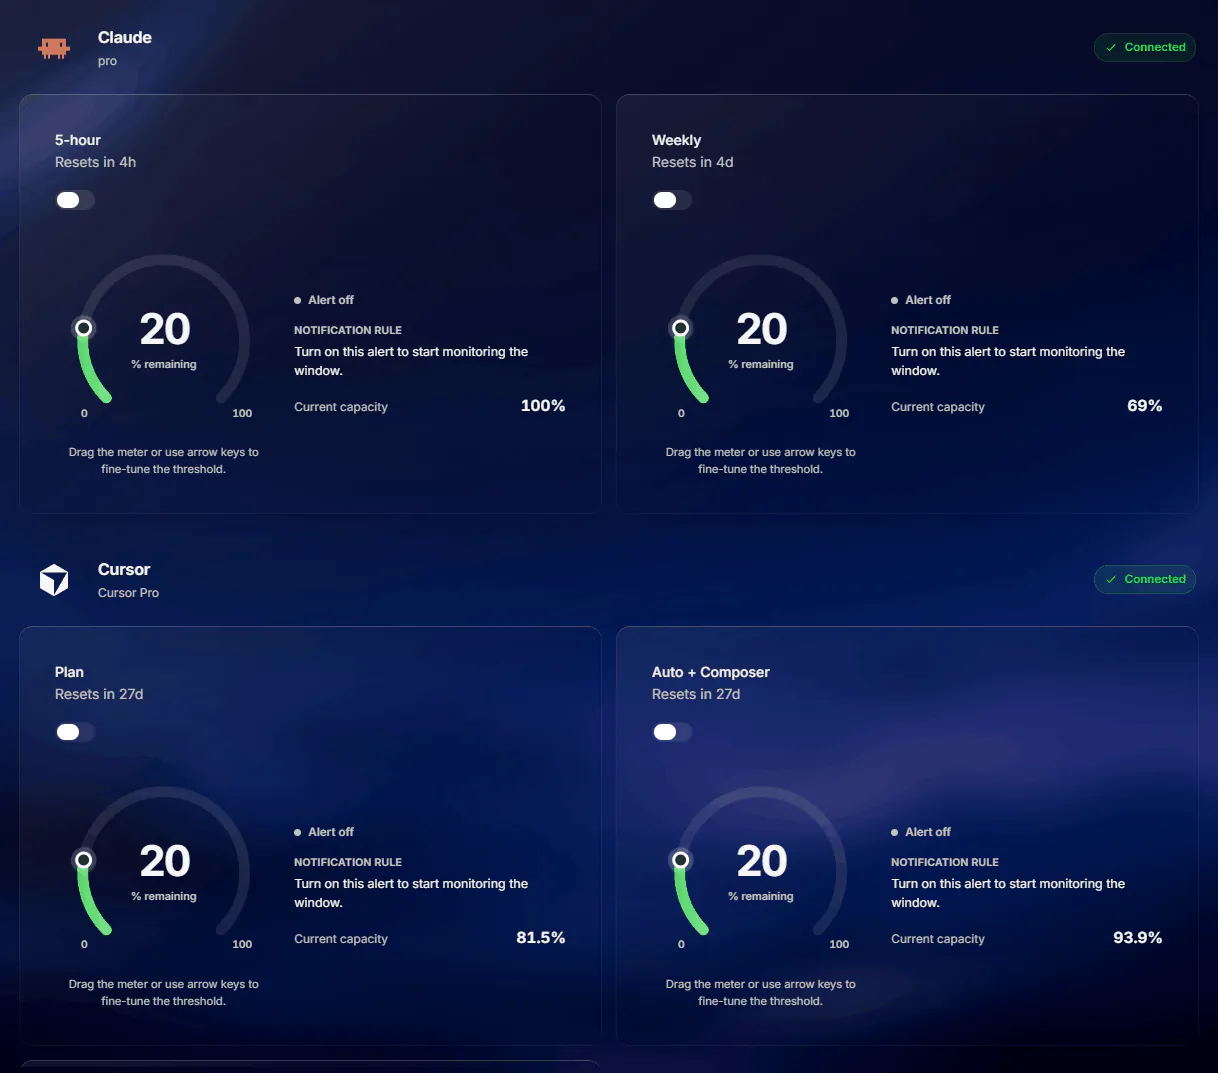
Compare what is left before you hand off the next task.

Alert thresholds grouped by tool: Claude's 5-hour and weekly windows and Cursor's plan and Auto plus Composer windows, each with its own dial and reset time.

Controls

Two menus, and they work on every view.

Narrow to a single tool or open it back up to all of them, then move through days and ranges. Both menus behave the same way everywhere in the app.

Filter by tool

Watch everything at once, or isolate one tool to see what it alone is costing you.
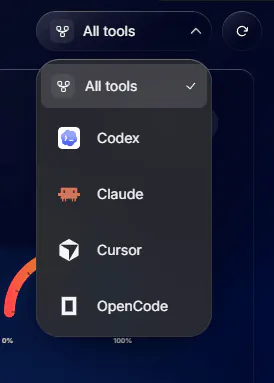
The tool filter menu listing All tools, Codex, Claude, Cursor, and OpenCode.

Pick a day or a range

Today, yesterday, a specific date, or the last 7, 30, and 90 days, up to your full collected history.
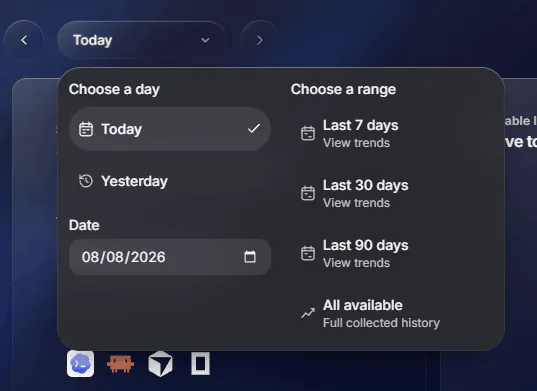
The date menu offering Today, Yesterday, a specific date, and ranges for the last 7, 30, and 90 days or all collected history.

Track locally. Save to the cloud if you choose.

Use UsageAtlas without an account. Create a free account to keep a copy of your usage history and restore it after changing or losing a computer. You control automatic saving in Settings.

  • No account required.Track the tools already signed in on your computer. If you want to save and restore usage history, create a free account and use cloud save.
  • Prompts and responses are never read.What reaches the dashboard is counts: tokens, requests, and cost. Message content stays where it was written.
  • Cloud saves contain usage summaries.Save totals, hourly activity, model breakdowns, and limits. Coding-tool credentials, raw logs, and project and session details are not included.
  • Analytics are only a headcount.The optional install count is separate from cloud save. It excludes account details, usage totals, and costs. You can switch it off in Settings.

Read the privacy policy

Questions, answered

The practical details, before you download.

What is an AI coding usage tracker?

An AI coding usage tracker shows activity and capacity across your tools. UsageAtlas brings supported tokens, requests, models, estimated costs, limits, and reset times into one local desktop dashboard.

Which tools does UsageAtlas support?

UsageAtlas currently supports Codex, Claude, Cursor, and OpenCode. Each source is added only after its sign-in path, error handling, and adapter tests are ready.

Can I see AI usage limits and reset times?

Yes. For supported provider windows, UsageAtlas shows remaining capacity and reset times, and can send one desktop alert per reset cycle at the threshold you choose.

Can UsageAtlas track Claude Code, Codex, and Cursor usage?

Yes. UsageAtlas tracks supported Claude Code five-hour and weekly windows, Codex session and weekly windows, and Cursor plan, Auto + Composer, and API usage, plus local OpenCode activity.

Do I need an account, and is cloud save free?

No account is needed for local tracking. Create a free account with Google or GitHub to save usage history and restore it on another computer. Hourly saving is on by default after desktop sign-in while the app is running, unless you previously turned it off. You can also save and restore manually in Settings.

Does UsageAtlas read prompts or responses?

No. UsageAtlas processes bounded usage aggregates. Prompts and responses are never read, and a separate UsageAtlas account is not required.

Looking for a specific answer? Read the UsageAtlas guides, including Claude Code usage history, how to check Codex usage, and how to see OpenCode usage.

Download

Take the whole picture with you.

UsageAtlas installs locally and picks up the supported tools already signed in on your computer. No account is required. Optional cloud save is free.

Windows 10 or later

Squirrel installer with automatic updates for 64-bit Windows.

macOS, Apple silicon or Intel

Signed and notarized disk images with automatic updates.

Linux, portable AppImage

Runs on common 64-bit x86 and ARM Linux distributions.

Every release publishes SHA-256 checksums. macOS packages are signed and notarized by Apple. Windows installers are not code-signed yet, so Windows may show a SmartScreen prompt the first time you install.

The whole picture. Not one tool at a time.

Quick enough to check before you start a task, detailed enough for a proper look at the month once the invoice lands.